| .github/workflows | ||
| docs/img | ||
| src/nqrduck_pulseprogrammer | ||
| .gitignore | ||
| CHANGELOG.md | ||
| LICENSE | ||
| pyproject.toml | ||
| README.md | ||
NQRduck Module: nqrduck-pulseprogrammer
A module for the nqrduck project. This module is used for graphical programming of pulse sequences for magnetic resonance experiments.
Installation
Requirements
Dependencies are handled via the pyproject.toml file.
Setup
To install the module you need the NQRduck core. You can find the installation instructions for the NQRduck core here.
Ideally you should install the module in a virtual environment. You can create a virtual environment by running the following command in the terminal:
python -m venv nqrduck
# Activate the virtual environment
. nqrduck/bin/activate
You can install this module and the dependencies by running the following command in the terminal while the virtual environment is activated and you are in the root directory of this module:
pip install .
Alternatively, you can install the module and the dependencies by running the following command in the terminal while the virtual environment is activated:
pip install nqrduck-pulseprogrammer
Usage
The module is used with the Spectrometer module. However you need to use an actual submodule of the spectromter module like:
- nqrduck-spectrometer-limenqr A module used for magnetic resonance experiments with the LimeSDR (USB or Mini 2.0).
- nqrduck-spectrometer-simulator A module used for simulating magnetic resonance experiments.
The pulse programmer provides an event based graphical user interface for programming pulse sequences. The pulse sequence can be programmed by adding events to the sequence. Columns of the pulse programmer represent the different events of the pulse sequence. The rows of the pulse sequence are the 'Pulse Parameter Options' provided by the spectrometer module. Pulse sequences can be saved and loaded as a '.quack' file.
The following picture depicts an exemplary Free Induction Decay (FID) pulse sequence.
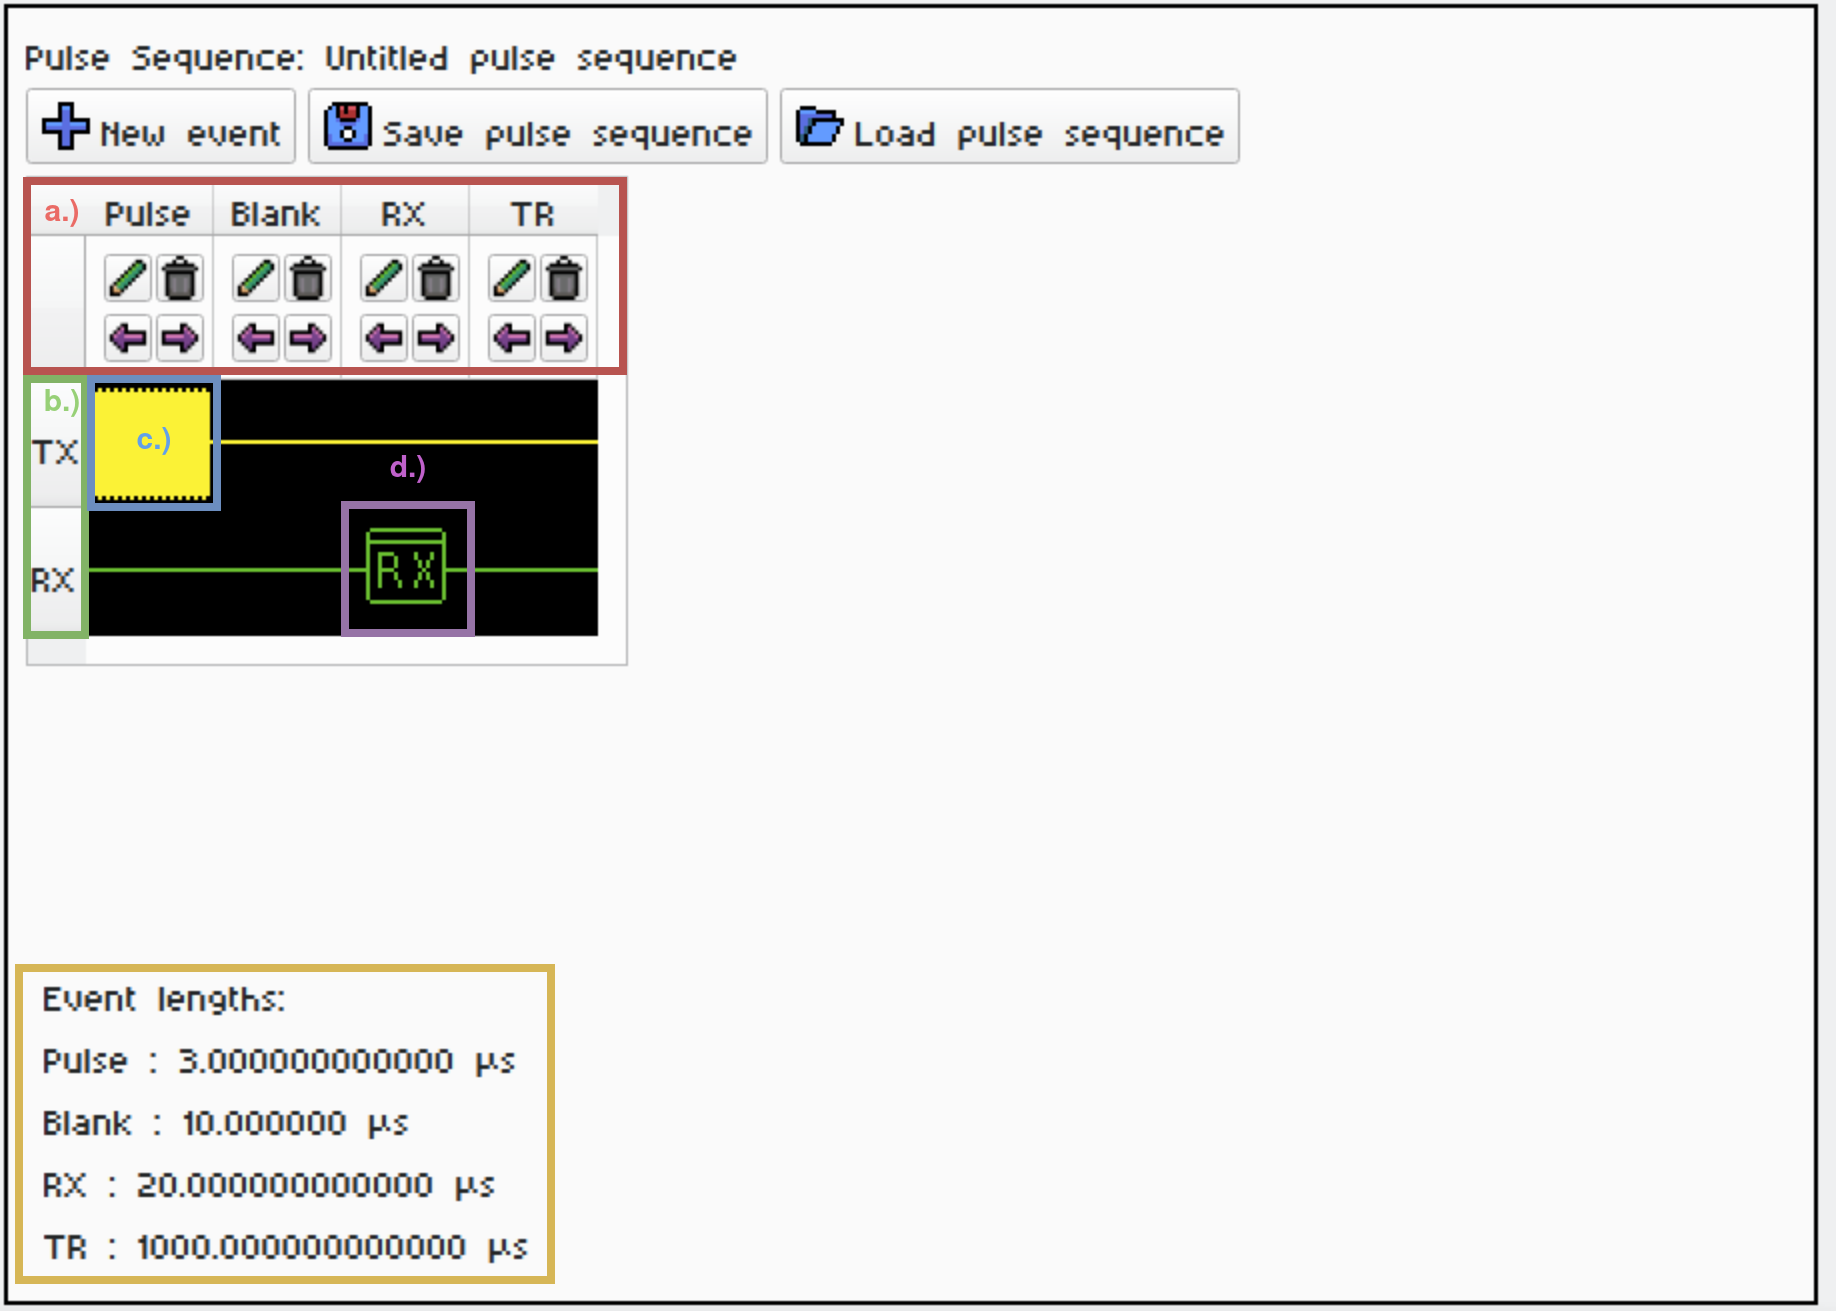
- a.) The different pulse sequence events. The events can be added to the pulse sequence by clicking on the '+ New Event' button.
- b.) The different 'Pulse Parameter Options' provided by the spectrometer module. The active spectrometer in the picture is the LimeNQR spectrometer. It provides 'Pulse Parameter Options' for 'TX' (Transmit) and 'RX' (Receive) events.
- c.) The 'Pulse' of the FID sequence. The graphical representation changes based on the settings of the 'Pulse Parameter Options'.
- d.) The 'RX' event of the FID sequence.
- e.) The lengths of the different events. The lengths can be adjusted by clicking on the 'Pen' icon of the event.
When clicking on the 'Pulse Parameter Options' of a certain column and row, a dialog window opens. The dialog window provides the user with the possibility to adjust the 'Pulse Parameter Options' of the event. The dialog window is different for each 'Pulse Parameter Option'.
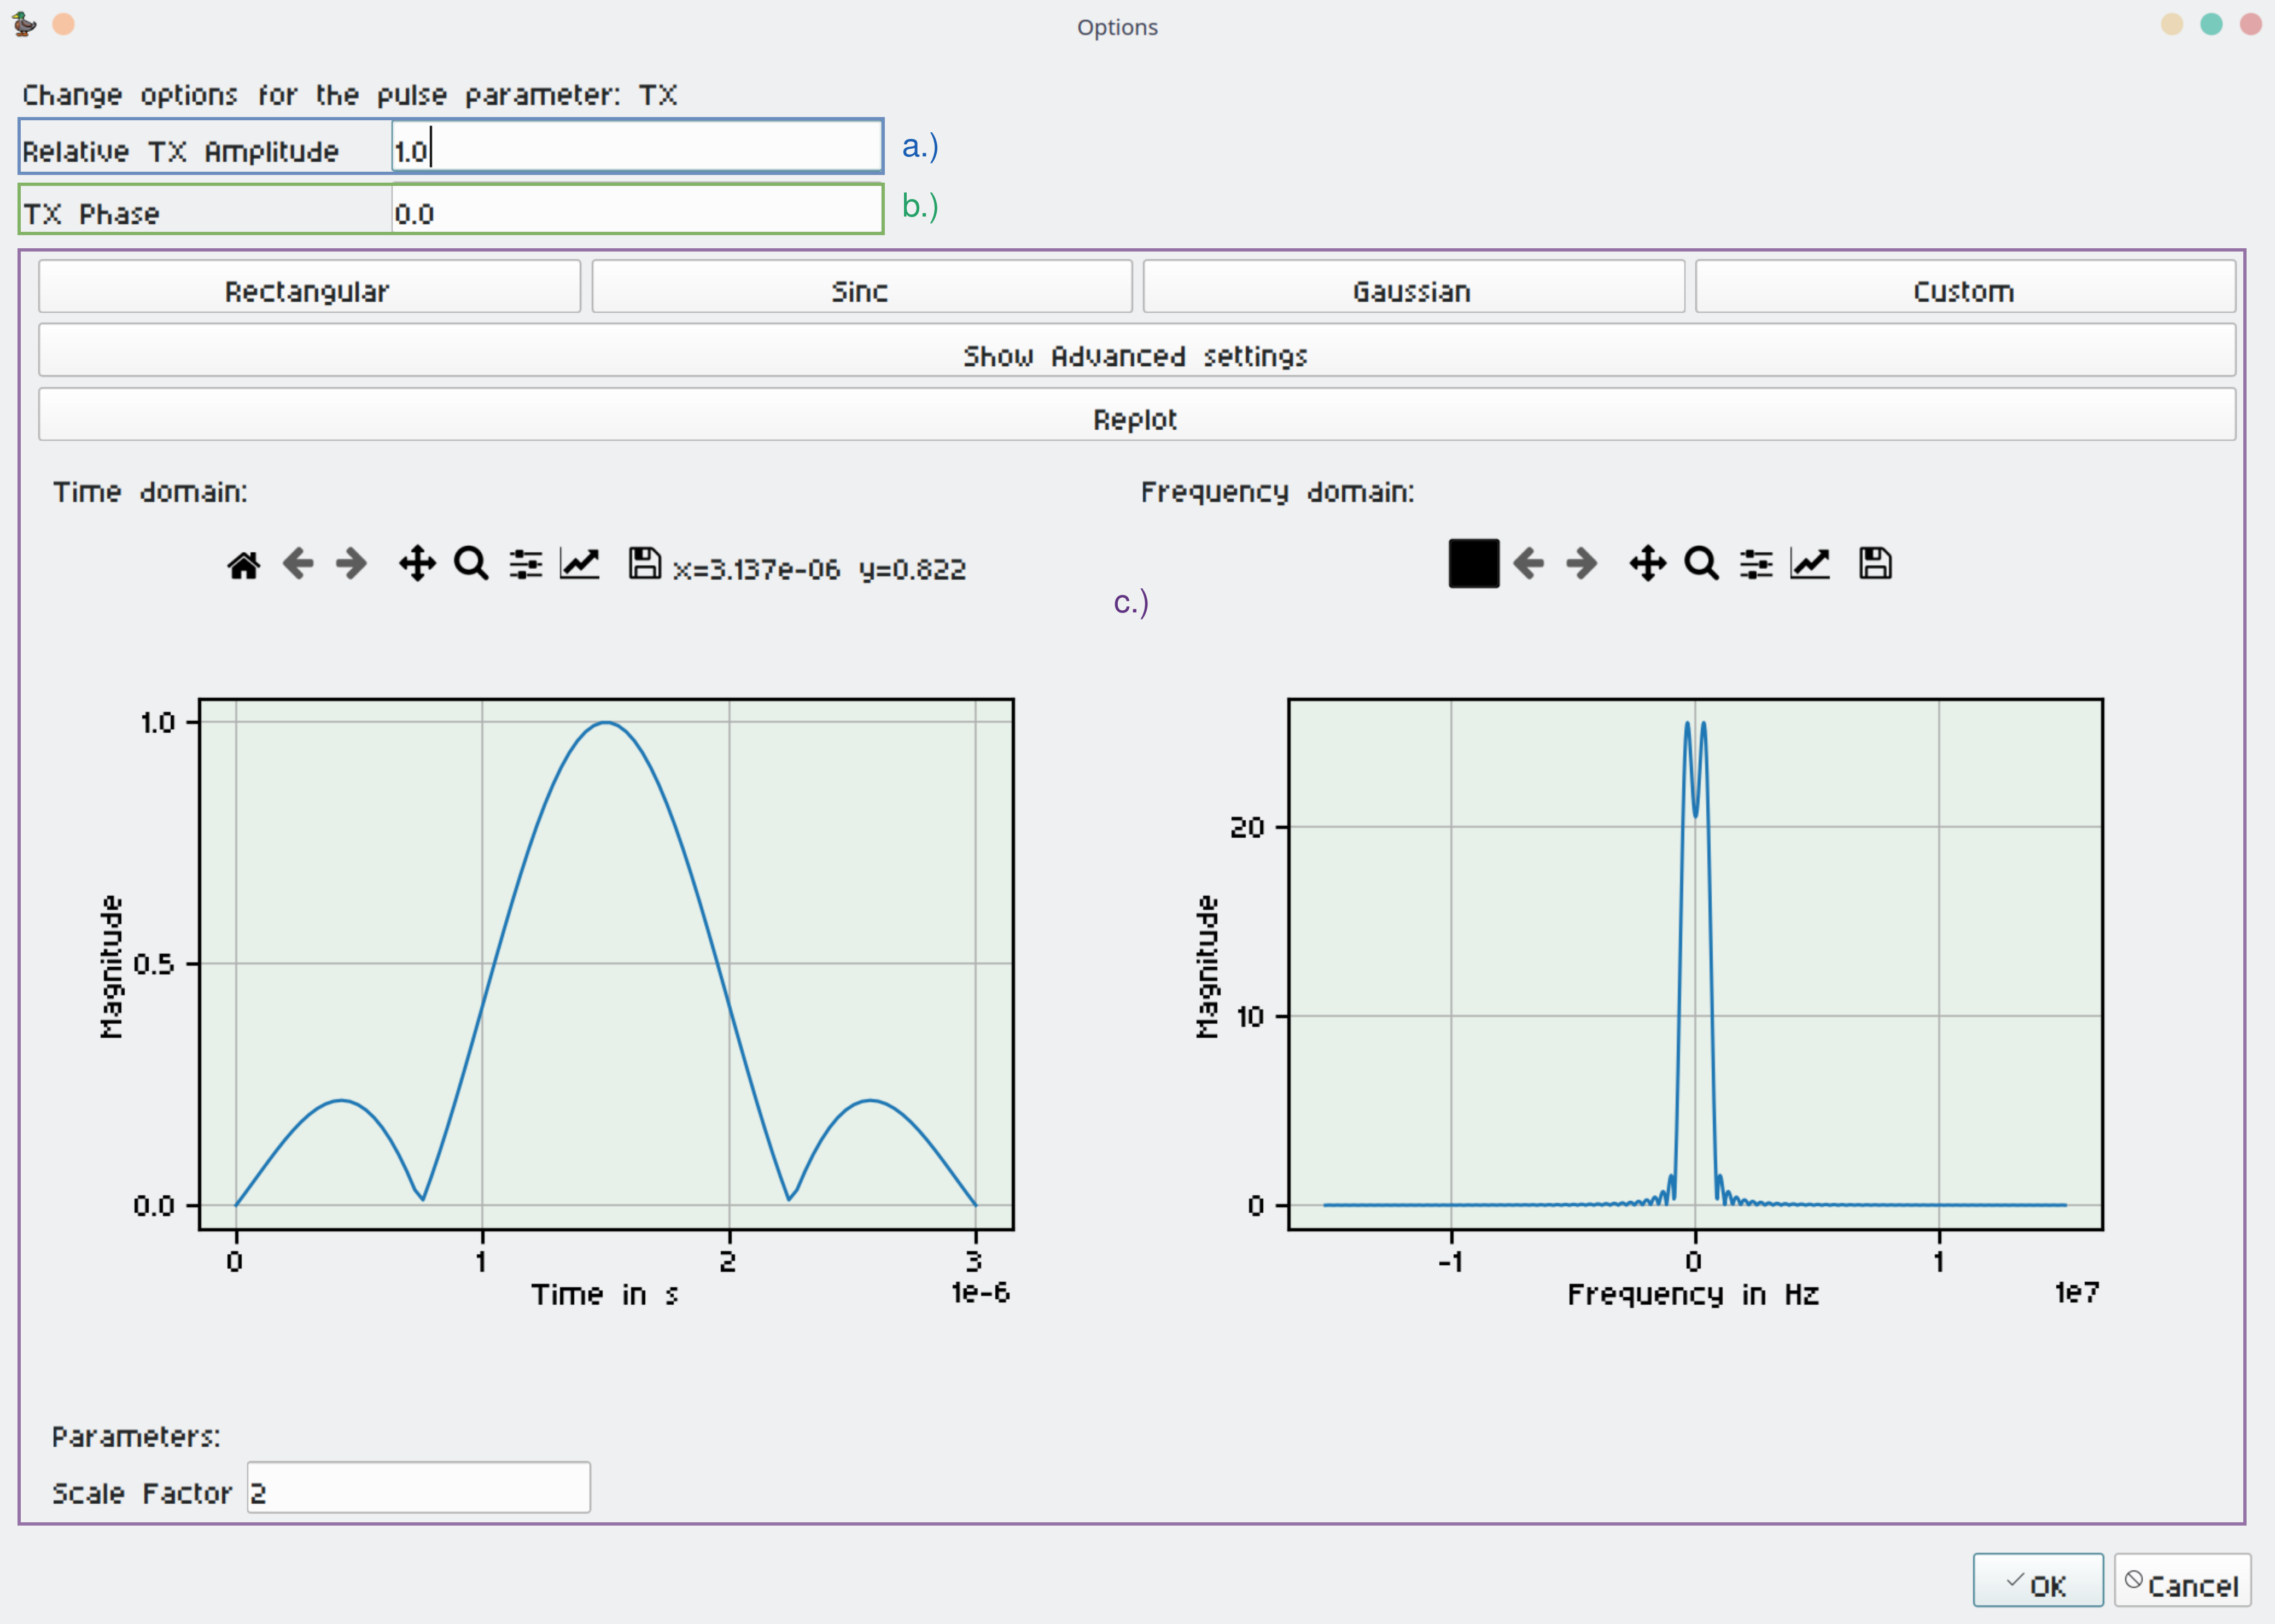
- a.) A numerical input field for the 'Relative TX Amplitude' of the 'TX' Pulse Parameter Option.
- b.) A numerical input field for the 'TX Phase' of the 'TX' Pulse Parameter Option.
- c.) A function selection option for the 'TX Function' of the 'TX' Pulse Parameter Option. This adjust the pulse shape of the 'TX' event (Rect, Sinc, Gaussian, Custom).
License
This project is licensed under the MIT License - see the LICENSE file for details
Contributing
If you're interested in contributing to the project, start by checking out our nqrduck-module template. To contribute to existing modules, please first open an issue in the respective module repository to discuss your ideas or report bugs.